|
These days, key decision makers are often challenged and overwhelmed by the exorbitant amount of information accessible to them. Saddled with the responsibility to react and make decisions based on the data within a limited time frame, it becomes imperative that the data be presented to them in a way that allows them to rely on their business instincts to make quick, yet accurate decisions.
Also, with the surge of data and big investments in infrastructure and technologies, companies want to leverage the value and insights hidden in their data to make better business decisions.
Challenges faced by Organizations:
- Inability to interpret and leverage available data
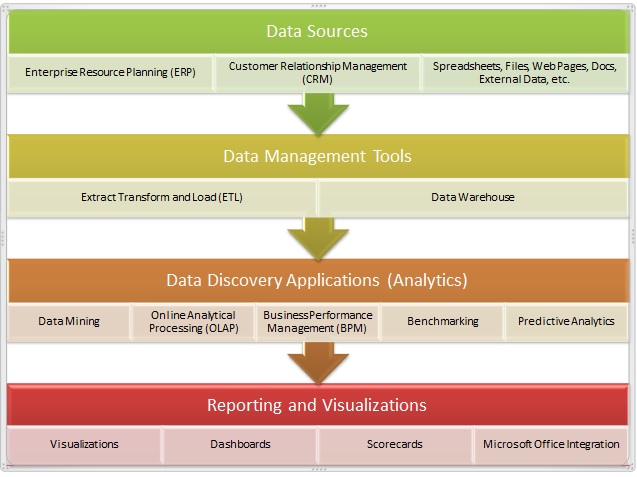
- Lack of end-to-end view: How data is collected, normalized, transformed and consumed by different business users
- Inability to translate business requirements into useful and timely data visualization
- Dashboards are not focused on the end users’ needs i.e. business users and decision makers
- Lack of in-house capabilities on the platforms or tools, leading to poor execution and low adoption
Data visualization, as a tool, is key in transforming business strategy to reality as it allows understanding where a company or division needs to focus. Data visualization is a flexible, end to end solution for faster development of business dashboards. Dashboards let organizations gain insights into their business, monitor key performance metrics, and help visualize information in a way that is easier to quantify. Dashboards are becoming one of the most valuable tools for organizations to gain visibility into how they are performing as well as help develop ways for increasing overall efficiencies.
The general purpose of dashboards and applying data visualization techniques is to help decision makers access and identify the right information, that when combined, provides additional insight leading to more informed decisions. Whether identifying sales performance against set targets, employee performance, or problem resolution rates, the fact is that dashboards have the flexibility to monitor and manage an organization’s every-day performance leading to better management and planning.

Benefits of Data visualization:
- Reveals bigger picture for an informed, broader perspective
- Demonstrates operational transparency
- Provide self-directed tools for analysis, understanding and empowerment
Whether you are utilizing an existing business intelligence system or planning on an end-to-end implementation, Nine Dimensions offers cost-effective solutions for creating sophisticated digital dashboards with visualizations of multi-dimensional datasets for empowering users quickly and easily. A key objective of our solution is to support decision making through the use of properly designed graphical representations of information.
With highlights like rich visualizations and enhanced interactivity through optimized drill downs, our Data Visualization solution is fast to deploy, easy to use and customizable as per your requirements - making it easier for your users to understand key metrics.
Our clients have been able to leverage our expertise to focus on building timely, robust, insightful analytics based strategies across departments and functions like sales, marketing, product and customer engagement to name a few.
|
